
0
2 Antworten
-
- Ninox Partner
- RoSoft_Steven_Rooryck
- vor 10 Monaten
- Gemeldet - anzeigen
Wow, look kinda like these I build 3 years ago : https://forum.ninox.com/t/p8hwqc7?r=x2hwhxg
-
- Rafael_Sanchis
- vor 10 Monaten
- Gemeldet - anzeigen
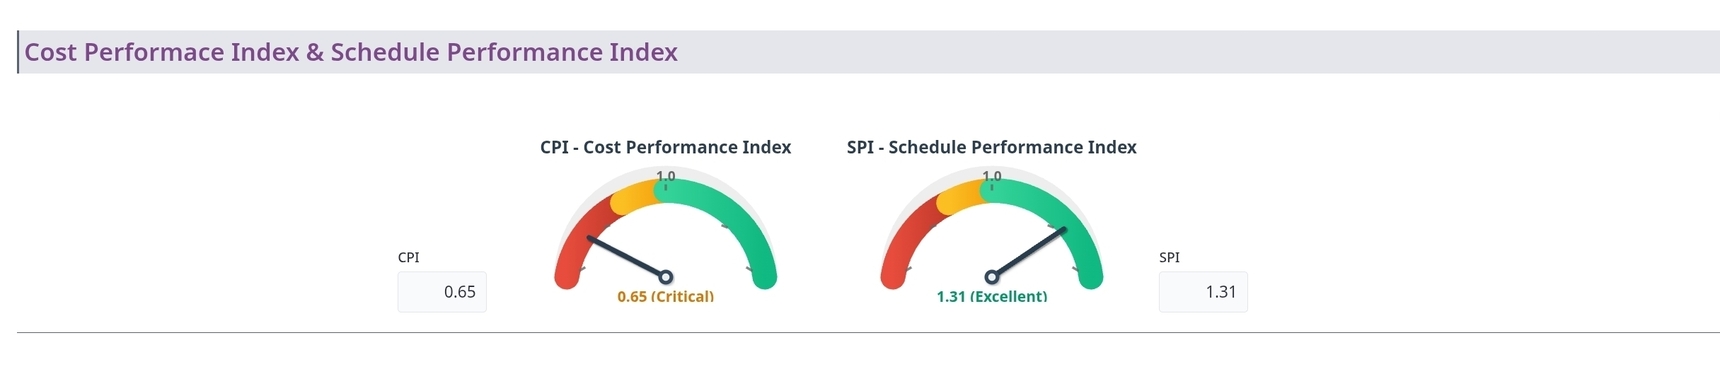
Hi Steven. The Code
let cpi := number(this.CPI);
if cpi = null or cpi = "" then
    cpi := 1
end;
let minCPI := 0.5;
let maxCPI := 1.5;
let normalizedCPI := if CPI < minCPI then
        minCPI
    else
        if cpi > maxCPI then maxCPI else cpi end
    end;
let status := if normalizedCPI >= 1.3 then
        "Excellent"
    else
        if normalizedCPI >= 1.1 then
            "Good"
        else
            if normalizedCPI >= 1 then
                "Acceptable"
            else
                if normalizedCPI >= 0.8 then
                    "Fair"
                else
                    if normalizedCPI >= 0.6 then "Critical" else "Losses" end
                end
            end
        end
    end;
let statusColor := if normalizedCPI >= 1.1 then
        "#f0fdf4"
    else
        if normalizedCPI >= 1 then
            "#f0fdf4"
        else
            if normalizedCPI >= 0.8 then
                "#fef3c7"
            else
                if normalizedCPI >= 0.6 then "#fffbeb" else "#fef2f2" end
            end
        end
    end;
let statusTextColor := if normalizedCPI >= 1.3 then
        "#059669"
    else
        if normalizedCPI >= 1.1 then
            "#16a34a"
        else
            if normalizedCPI >= 1 then
                "#65a30d"
            else
                if normalizedCPI >= 0.8 then
                    "#d97706"
                else
                    if normalizedCPI >= 0.6 then "#d97706" else "#dc2626" end
                end
            end
        end
    end;
let angulo := (normalizedCPI - minCPI) / (maxCPI - minCPI) * 180 + 180;
let rad := angulo * 3.14159 / 180;
let x2 := 120 + round(70 * cos(rad));
let y2 := 120 + round(70 * sin(rad));
html("
<svg width='240' height='140' viewBox='0 0 240 140' xmlns='http://www.w3.org/2000/svg'>
  <defs>
    <linearGradient id='redGrad' x1='0%' y1='0%' x2='100%' y2='0%'>
      <stop offset='0%' style='stop-color:#e74c3c'/>
      <stop offset='100%' style='stop-color:#c0392b'/>
    </linearGradient>
    <linearGradient id='orangeGrad' x1='0%' y1='0%' x2='100%' y2='0%'>
      <stop offset='0%' style='stop-color:#fbbf24'/>
      <stop offset='100%' style='stop-color:#f59e0b'/>
    </linearGradient>
    <linearGradient id='greenGrad' x1='0%' y1='0%' x2='100%' y2='0%'>
      <stop offset='0%' style='stop-color:#34d399'/>
      <stop offset='100%' style='stop-color:#10b981'/>
    </linearGradient>
    <filter id='shadow'>
      <feDropShadow dx='1' dy='1' stdDeviation='1' flood-opacity='0.3'/>
    </filter>
  </defs>

  <!-- Título -->
  <text x='120' y='20' font-size='14' font-weight='bold' text-anchor='middle' fill='#2c3e50'>CPI - Cost Performance Index</text>

  <!-- Fondo del gauge -->
  <path d='M40,120 A80,80 0 0,1 200,120' fill='none' stroke='#eee' stroke-width='20' stroke-linecap='round'/>

  <!-- Segmentos de colores según categoría -->
  <path d='M40,120 A80,80 0 0,1 85,60' fill='none' stroke='url(#redGrad)' stroke-width='20' stroke-linecap='round'/>
  <path d='M85,60 A80,80 0 0,1 120,50' fill='none' stroke='url(#orangeGrad)' stroke-width='20' stroke-linecap='round'/>
  <path d='M120,50 A80,80 0 0,1 200,120' fill='none' stroke='url(#greenGrad)' stroke-width='20' stroke-linecap='round'/>

  <!-- Marcas de escala -->
  <g stroke='#666' stroke-width='2' opacity='0.8'>
    <line x1='50' y1='115' x2='55' y2='112'/>
    <line x1='70' y1='80' x2='75' y2='78'/>
    <line x1='120' y1='50' x2='120' y2='45'/>
    <line x1='170' y1='80' x2='165' y2='78'/>
    <line x1='190' y1='115' x2='185' y2='112'/>
  </g>

  <!-- Etiqueta valor 1.0 -->
  <text x='120' y='42' font-size='11' fill='#666' text-anchor='middle' font-weight='bold'>1.0</text>

  <!-- Aguja -->
  <line x1='120' y1='120' x2='" +
(x2 + 1) +
"' y2='" +
(y2 + 1) +
"' stroke='rgba(0,0,0,0.2)' stroke-width='5' stroke-linecap='round'/>
  <line x1='120' y1='120' x2='" +
x2 +
"' y2='" +
y2 +
"' stroke='#2c3e50' stroke-width='4' stroke-linecap='round' filter='url(#shadow)'/>

  <!-- Centro -->
  <circle cx='120' cy='120' r='6' fill='#34495e' filter='url(#shadow)'/>
  <circle cx='120' cy='120' r='3' fill='#ecf0f1'/>

  <!-- Valor y categoría -->
  <text x='120' y='140' font-size='12' font-weight='bold' text-anchor='middle' fill='" +
statusTextColor +
"'>" +
round(normalizedCPI, 2) +
" (" +
status +
")</text>
</svg>
")
Content aside
- vor 10 MonatenZuletzt aktiv
- 2Antworten
- 76Ansichten
-
2
Folge bereits